> ## Documentation Index
> Fetch the complete documentation index at: https://forest-chore-open-api.mintlify.site/llms.txt
> Use this file to discover all available pages before exploring further.
# Create an API-based Chart
### Creating an API-based Chart
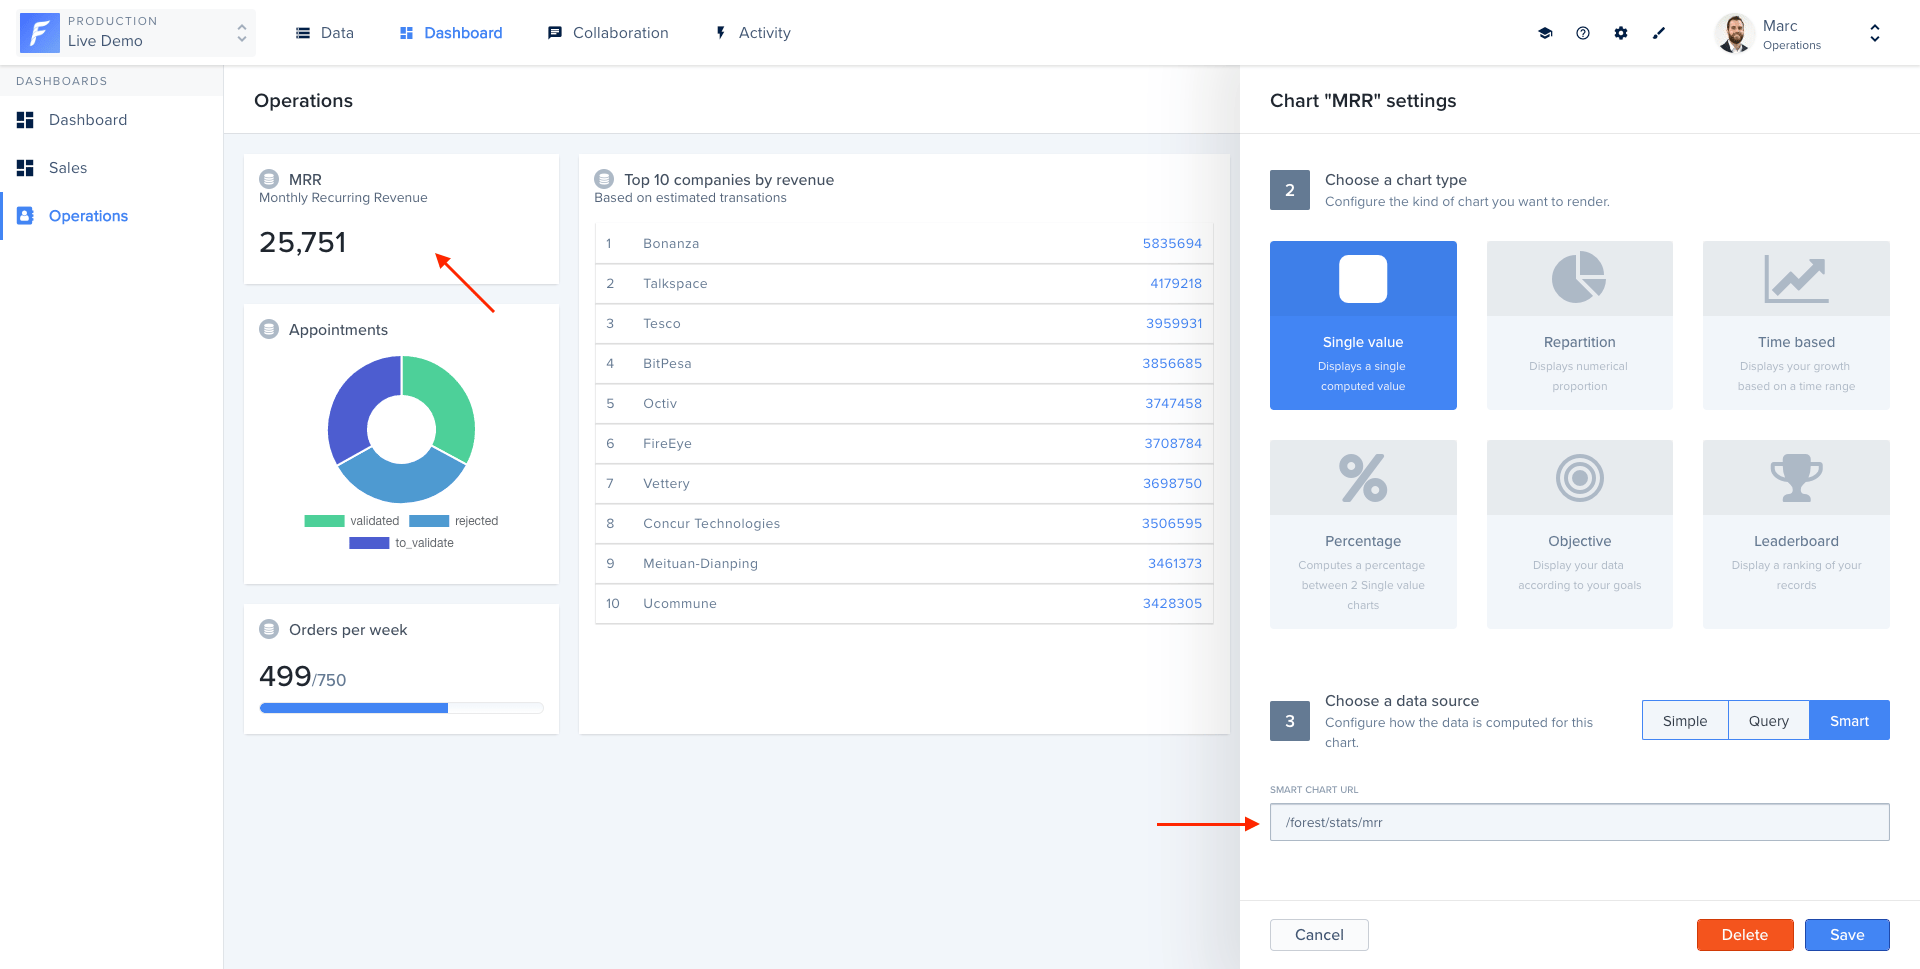
Sometimes, charts data are complicated and closely tied to your business. Forest allows you to code how the chart is computed. Choose **API** as the data source when configuring your chart.
.png?fit=max&auto=format&n=l9oWVTFSA2iV8NAX&q=85&s=b67c1ae108e6c090d8f3999c4ca7ec65) Forest will make the HTTP call to Smart Chart URL when retrieving the chart values for the rendering.
### Value API-based Chart
On our Live Demo, we have a `MRR` value chart which computes our Monthly Recurring Revenue. This chart queries the Stripe API to get all charges made in the current month (in March for this example).
When serializing the data, we use the `serialize_model()` method. Check the `value` syntax below.
```
{ value: }
```
```ruby theme={null}
Rails.application.routes.draw do
# MUST be declared before the mount ForestLiana::Engine.
namespace :forest do
post '/stats/mrr' => 'charts#mrr'
end
mount ForestLiana::Engine => '/forest'
end
```
```ruby theme={null}
class Forest::ChartsController < ForestLiana::ApplicationController
def mrr
mrr = 0
from = Date.parse('2018-03-01').to_time(:utc).to_i
to = Date.parse('2018-03-31').to_time(:utc).to_i
Stripe::Charge.list({
created: { gte: from, lte: to },
limit: 100
}).each do |charge|
mrr += charge.amount / 100
end
stat = ForestLiana::Model::Stat.new({ value: mrr })
render json: serialize_model(stat)
end
end
```
Forest will make the HTTP call to Smart Chart URL when retrieving the chart values for the rendering.
### Value API-based Chart
On our Live Demo, we have a `MRR` value chart which computes our Monthly Recurring Revenue. This chart queries the Stripe API to get all charges made in the current month (in March for this example).
When serializing the data, we use the `serialize_model()` method. Check the `value` syntax below.
```
{ value: }
```
```ruby theme={null}
Rails.application.routes.draw do
# MUST be declared before the mount ForestLiana::Engine.
namespace :forest do
post '/stats/mrr' => 'charts#mrr'
end
mount ForestLiana::Engine => '/forest'
end
```
```ruby theme={null}
class Forest::ChartsController < ForestLiana::ApplicationController
def mrr
mrr = 0
from = Date.parse('2018-03-01').to_time(:utc).to_i
to = Date.parse('2018-03-31').to_time(:utc).to_i
Stripe::Charge.list({
created: { gte: from, lte: to },
limit: 100
}).each do |charge|
mrr += charge.amount / 100
end
stat = ForestLiana::Model::Stat.new({ value: mrr })
render json: serialize_model(stat)
end
end
```
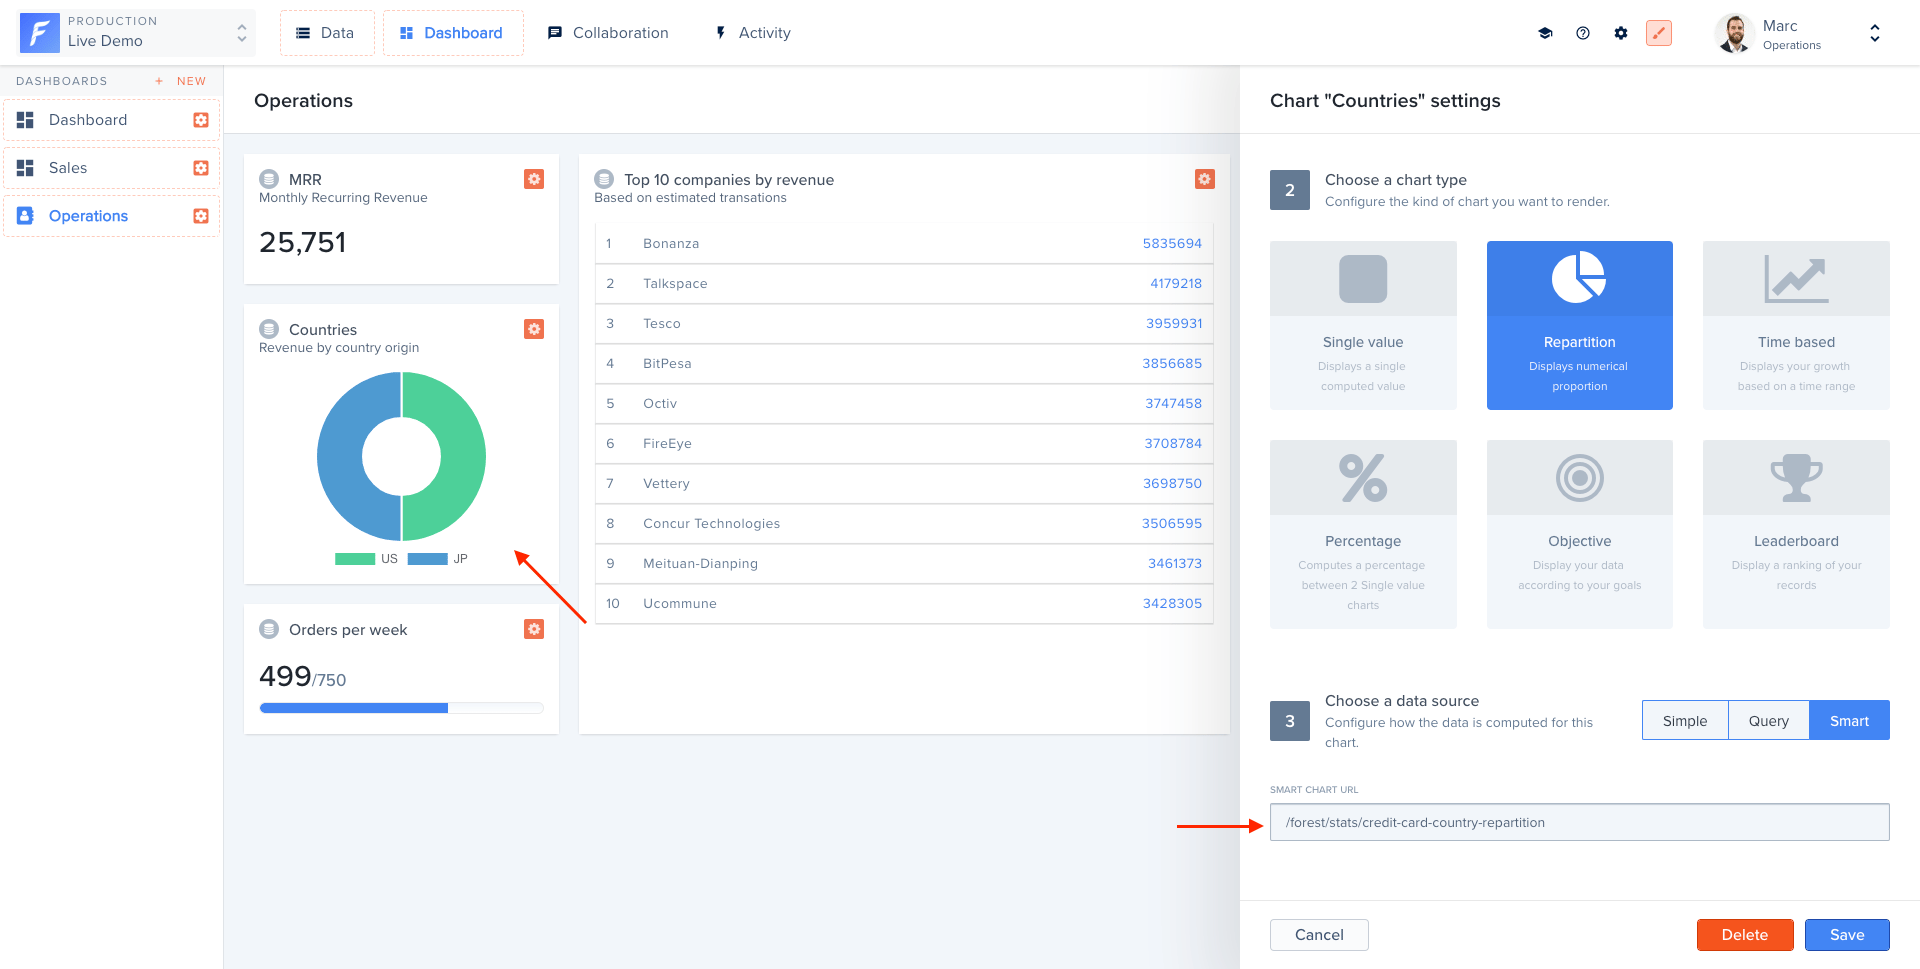
 ### Repartition API-based Chart
On our Live Demo, we have a `Charges` repartition chart which shows a repartition chart distributed by credit card country. This chart queries the Stripe API to get all charges made in the current month (in March for this example) and check the credit card country.
When serializing the data, we use the `serialize_model()` method. Check the `value` syntax below.
```
{
value: [{
key: ,
value:
}, {
key: ,
value:
}, …]
}
```
```ruby theme={null}
Rails.application.routes.draw do
# MUST be declared before the mount ForestLiana::Engine.
namespace :forest do
post '/stats/credit-card-country-repartition' => 'charts#credit_card_country_repartition'
end
mount ForestLiana::Engine => '/forest'
end
```
```ruby theme={null}
class Forest::ChartsController < ForestLiana::ApplicationController
def credit_card_country_repartition
repartition = []
from = Date.parse('2018-03-01').to_time(:utc).to_i
to = Date.parse('2018-03-20').to_time(:utc).to_i
Stripe::Charge.list({
created: { gte: from, lte: to },
limit: 100
}).each do |charge|
country = charge.source.country || 'Others'
entry = repartition.find { |e| e[:key] == country }
if !entry
repartition << { key: country, value: 1 }
else
++entry[:value]
end
end
stat = ForestLiana::Model::Stat.new({ value: repartition })
render json: serialize_model(stat)
end
end
```
```
{
value: [{
key: ,
value:
}, {
key: ,
value:
}, …]
}
```
### Repartition API-based Chart
On our Live Demo, we have a `Charges` repartition chart which shows a repartition chart distributed by credit card country. This chart queries the Stripe API to get all charges made in the current month (in March for this example) and check the credit card country.
When serializing the data, we use the `serialize_model()` method. Check the `value` syntax below.
```
{
value: [{
key: ,
value:
}, {
key: ,
value:
}, …]
}
```
```ruby theme={null}
Rails.application.routes.draw do
# MUST be declared before the mount ForestLiana::Engine.
namespace :forest do
post '/stats/credit-card-country-repartition' => 'charts#credit_card_country_repartition'
end
mount ForestLiana::Engine => '/forest'
end
```
```ruby theme={null}
class Forest::ChartsController < ForestLiana::ApplicationController
def credit_card_country_repartition
repartition = []
from = Date.parse('2018-03-01').to_time(:utc).to_i
to = Date.parse('2018-03-20').to_time(:utc).to_i
Stripe::Charge.list({
created: { gte: from, lte: to },
limit: 100
}).each do |charge|
country = charge.source.country || 'Others'
entry = repartition.find { |e| e[:key] == country }
if !entry
repartition << { key: country, value: 1 }
else
++entry[:value]
end
end
stat = ForestLiana::Model::Stat.new({ value: repartition })
render json: serialize_model(stat)
end
end
```
```
{
value: [{
key: ,
value:
}, {
key: ,
value:
}, …]
}
```
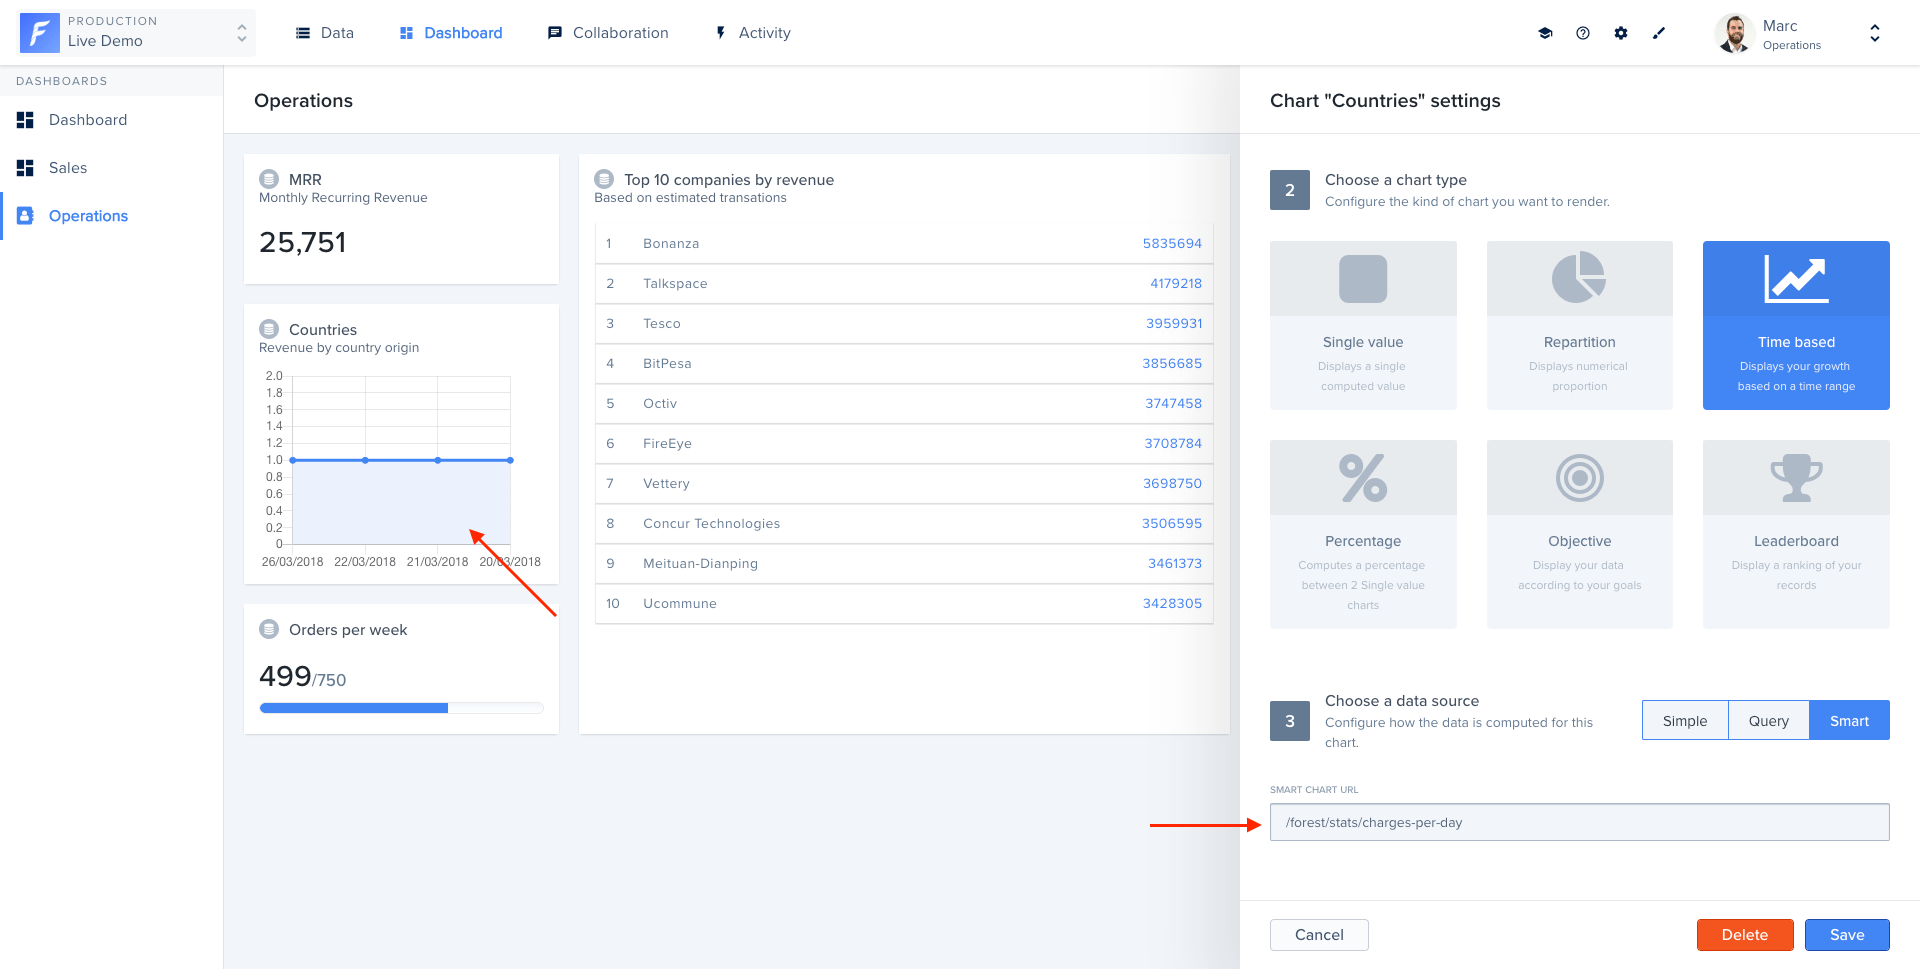
 ### Time-based API-based Chart
On our Live Demo, we have a `Charges` time-based chart which shows the number of charges per day. This chart queries the Stripe API to get all charges made in the current month (in March for this example) and group data by day.
When serializing the data, we use the `serialize_model()` method. Check the `value` syntax below.
```
{
value: [{
label: ,
values: { value: }
}, {
label: ,
values: { value: }
}, …]
}
```
```ruby theme={null}
Rails.application.routes.draw do
# MUST be declared before the mount ForestLiana::Engine.
namespace :forest do
post '/stats/charges-per-day' => 'charts#charges_per_day'
end
mount ForestLiana::Engine => '/forest'
end
```
```ruby theme={null}
class Forest::ChartsController < ForestLiana::ApplicationController
def charges_per_day
values = []
from = Date.parse('2018-03-01').to_time(:utc).to_i
to = Date.parse('2018-03-31').to_time(:utc).to_i
Stripe::Charge.list({
created: { gte: from, lte: to },
limit: 100
}).each do |charge|
date = Time.at(charge.created).beginning_of_day.strftime("%d/%m/%Y")
entry = values.find { |e| e[:label] == date }
if !entry
values << { label: date, values: { value: 1 } }
else
++entry[:values][:value]
end
end
stat = ForestLiana::Model::Stat.new({ value: values })
render json: serialize_model(stat)
end
end
```
```
{
value: [{
label: ,
values: { value: }
}, {
label: ,
values: { value: }
}, …]
}
```
### Time-based API-based Chart
On our Live Demo, we have a `Charges` time-based chart which shows the number of charges per day. This chart queries the Stripe API to get all charges made in the current month (in March for this example) and group data by day.
When serializing the data, we use the `serialize_model()` method. Check the `value` syntax below.
```
{
value: [{
label: ,
values: { value: }
}, {
label: ,
values: { value: }
}, …]
}
```
```ruby theme={null}
Rails.application.routes.draw do
# MUST be declared before the mount ForestLiana::Engine.
namespace :forest do
post '/stats/charges-per-day' => 'charts#charges_per_day'
end
mount ForestLiana::Engine => '/forest'
end
```
```ruby theme={null}
class Forest::ChartsController < ForestLiana::ApplicationController
def charges_per_day
values = []
from = Date.parse('2018-03-01').to_time(:utc).to_i
to = Date.parse('2018-03-31').to_time(:utc).to_i
Stripe::Charge.list({
created: { gte: from, lte: to },
limit: 100
}).each do |charge|
date = Time.at(charge.created).beginning_of_day.strftime("%d/%m/%Y")
entry = values.find { |e| e[:label] == date }
if !entry
values << { label: date, values: { value: 1 } }
else
++entry[:values][:value]
end
end
stat = ForestLiana::Model::Stat.new({ value: values })
render json: serialize_model(stat)
end
end
```
```
{
value: [{
label: ,
values: { value: }
}, {
label: ,
values: { value: }
}, …]
}
```
 ### Objective API-based Chart
Creating an Objective Smart Chart means you'll be fetching your data from an external API endpoint:
### Objective API-based Chart
Creating an Objective Smart Chart means you'll be fetching your data from an external API endpoint:
.png?fit=max&auto=format&n=l9oWVTFSA2iV8NAX&q=85&s=172d4ad13a07e6de8d812959dfdc2dcd) This endpoint must return data with the following format:
```
{
value: {
value: xxxx,
objective: yyyy
}
}
```
Here's how you could implement it:
```ruby theme={null}
...
namespace :forest do
post '/stats/some-objective' => 'customers#some_objective'
end
...
```
```ruby theme={null}
...
def some_objective
# fetch your data here
stat = ForestLiana::Model::Stat.new({
value: {
value: 10, # the fetched value
objective: 678 # the fetched objective
}
})
render json: serialize_model(stat)
end
...
```
```
{
value: {
value: xxxx,
objective: yyyy
}
}
```
This endpoint must return data with the following format:
```
{
value: {
value: xxxx,
objective: yyyy
}
}
```
Here's how you could implement it:
```ruby theme={null}
...
namespace :forest do
post '/stats/some-objective' => 'customers#some_objective'
end
...
```
```ruby theme={null}
...
def some_objective
# fetch your data here
stat = ForestLiana::Model::Stat.new({
value: {
value: 10, # the fetched value
objective: 678 # the fetched objective
}
})
render json: serialize_model(stat)
end
...
```
```
{
value: {
value: xxxx,
objective: yyyy
}
}
```